Caveat: this indicator works best with indices and highly liquid stocks. It is not recommended for stocks with poor liquidity (for that matter, any indicator).
Basic logic/ concept
When any stock has to rally, it has to cross some levels. This can be prior resistance, last hour's high or last week's or month's highs etc etc.
For fewer and longer signals, you can also choose say quarterly breakout by using 60 days as reference level. Using less than 20 is not recommended due to high number of signals and whipsaws.
A feature of markets all traders must understand... a market is either trending or rangebound. Some traders look at a trend as nothing but a series of range breakouts. Now a stock will show fantastic move only when there is a breakout from a range.
Probability and trading outcomes
The outcome of any trade is random. This means for a large number of trades, there will be a uniform distribution of trades giving small profits, small losses, big profits and big losses. The trades with small profits and losses will cancel each other and you are left with trades with big profits and big losses. So how do you make money?
You can make money only by (a) cutting losses fast and (b) let profit making trades continue as long as possible.
The KPL swing indicator helps you ride the trend and lock in profits via a trailing stoploss.
Risk management / Position sizing
Losses are inevitable in trading. As a trader, your primary objective is loss minimization (and not profit maximization).
Risk management defines your maximum loss in any trade. My personal experience is you should limit your maximum loss per trade to under 1% of your trading capital.
Quantity to buy = (1% of trading capital) / (Purchase Price - Stoploss) .
Further, do NOT invest more than 5% of your capital in any single trade.
About whipsaws
All indicators give whipsaws and the KPLSwing indicator is no exception. But it is easy to know when a signal is likely to generate a whipsaw.
The first warning will be where the stock is trading in a small range for a long time. Here it is possible to get a buy signal today followed by a sell signal in next few days.
The second is where a buy signal is generated near a known/ significant resistance.
When you get a whipsaw or 2 loss making trades for the same stock, then it makes sense to ignore further signals until the stock breaks out from the range.
Another way to identify rangebound stocks is to just see the price movement over last 5-6 months... if the stock has not gained or lost much then it means it is directionless and hence rangebound.
Ditto for the sell side.
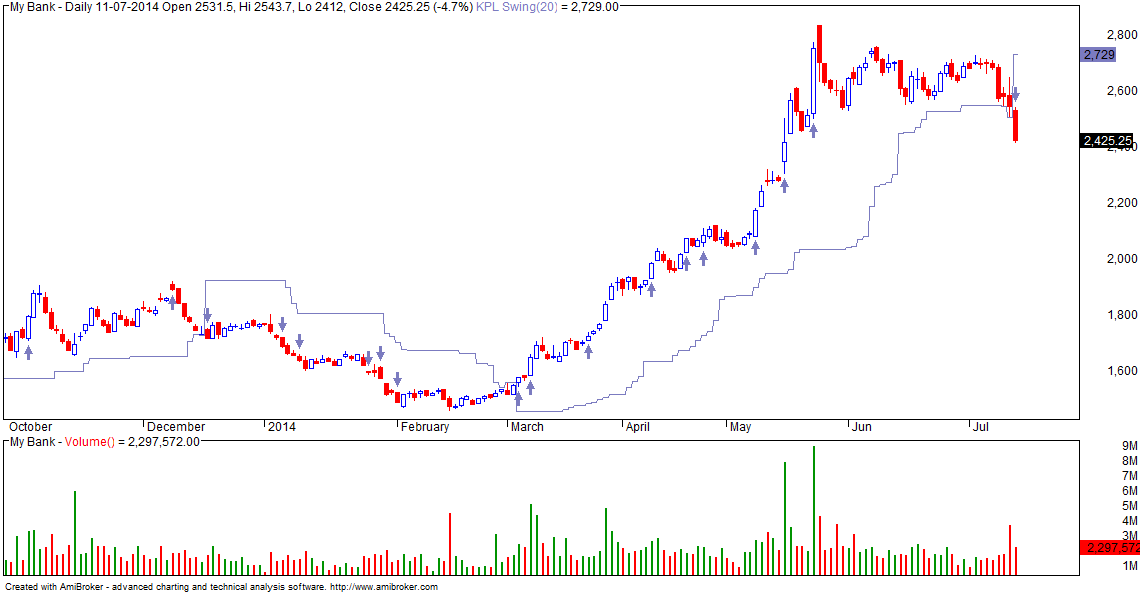
Now the indicator in action - same stock, different charts... 4-5 years
Installing the indicator:
- You must have Amibroker installed in your PC. If you do not have this, download a trial version from Amibroker.com.
- Download formula file (right click with mouse) kpl_swing.afl and save in C:/Program files/Amibroker/Formulas/Custom folder. Save the file with name kpl_swing.afl
- Start Amibroker and click on View/ Charts. Open the Custom folder and you should see the "kpl_swing" indicator file.
- Drag and drop the indicator on the price/ chart pane/ window.
Entry and Exit Rules:
- Default indicator setting is N=20 days (or bars).
- DEfault trailing stoploss is 1/2 of N ... i.e 10 days (or bars).
- Entry conditions: Indicator generates a BUY signal (arrow). Confirm there is range breakout.
- Exits: based on trailing SL. Close position whenever stock closes below 10 bars low.
- Similarly, trade short on break of 20 bar low with trailing SL at 10 bar high.
- Do not risk more than 1% of your capital in any trade
- Note: you can use this indicator on 5 / 15/ 30 min or daily/ weekly charts .
Generating Buy/ Sell Signals:
- You can use the indicator to generate Long/ Short signals.
- To generate signals, use the indicator in Scanner mode
- Available signals are Buy, Sell, Short and Cover.
- It is advisable to run the Scanner on a watchlist of say NIFTY 100 stocks or NIFTY 200 stocks.
- Ignore signals generated for stocks with low volume.